This is Part 2 retention masterclass. In case you haven’t read Part 1, I would suggest you give it a read. For the new ones here, do check out the other posts that I have written if you haven’t
3,000+ people have subscribed to the growth catalyst newsletter so far. To receive the newsletter weekly in your email, consider subscribing 👇
If you aren’t familiar with the newsletter and online sessions, you can read about it here
Off to the post,
“It's supposed to be hard. If it were easy, everyone would do it.” ― Tom Hanks in A League of Their Own
The quote refers to baseball in the movie. Though it’s true about anything in general in life. What does it have to do anything with retention? You can say the same about retention when it comes to building and growing products. Retention is worth chasing without a doubt, but also one of the hardest metrics to move.
So when you want to improve retention and go to Google searching for answers, there is a lot of advice around what to do to improve retention. The problem with this advice is that it makes it all look so easy.
Which begs the question — “if it were so easy, why isn’t everyone doing it?” Because it’s not.
Recognizing that retention is a hard-to-move metric is the first step in improving it. I speak it from my personal experiences because I have seen people including myself taking ambitious goals on retention. Setting big goals isn’t problematic in itself, but having wrong expectations that few features in onboarding, notifications, user flows, etc. is going to fix retention in a quarter is a problem.
Are you wondering if you have a retention problem?
Do I have a Retention Problem?
Broadly, we can classify the retention problems into two types.
Type I: Curve flattening
The curve is flattening but lower than benchmarks.
I wrote about how to get the benchmarks in the last post so you can check it out if you are unsure about how to benchmark.
Type II: Curve not flattening
Look at the daily/weekly/monthly retention curve. If it’s not flattening like the red line, we are in a tough spot. Exactly how troublesome is this? We can understand it through scenario analysis.
Scenario Analysis
To do scenario analysis, we will take a few variables and make certain assumptions.
Type I retention — If it’s flattening, let’s assume it flattens at y% in n days
Type II retention— If it’s not flattening, let’s assume it reaches 0% in n days
NU = Avg. new daily users
x% = Avg. daily retention for the first n days
We can write the DAU equation for a year (365 days) as follows:
DAU in a year = NU* [(x*n + y*(365-n)]
Scenario A: You have to get to 50 k DAU in 12 months
y = 10% in Type I and 0% in Type II, n=90 days, x= 25%
For Type I, we need 1156 new users daily. INR 36.5 L in 12 months.
DAU = 1000* [(0.25*90+0.1*(365-90)] = 1000*[50] = 50,000
For Type II, we need 2222 new users daily. This will cost us INR 80.3 L in 12 months.
DAU = 2222* [(0.25*90+0*(365-90)] = 2222*[22.5] = 50,000
To reach 50 k DAU, we need to spend 2.2x money in type II compared to type I.
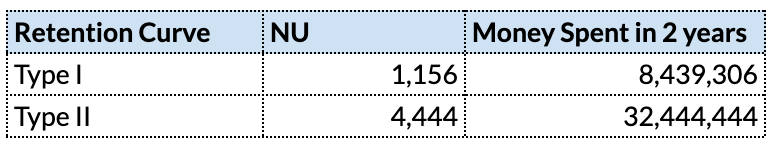
Scenario B: You have to get to 100 k DAU in 24 months
y = 10% in Type I and 0% in Type II, n=90 days, x= 25%
To reach 100 k DAU, we need to spend 4x money in Type II compared to type I
As you can see, the requirement of money keeps increasing with time to get the same outcome in Type II.
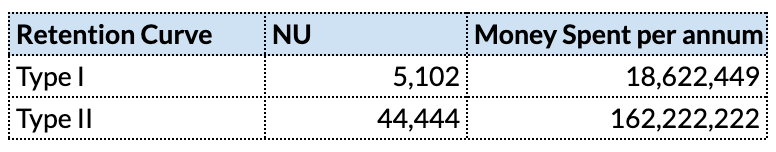
Scenario C: Let’s stretch the time to 5 years and target 1 million DAU
y = 10% in Type I and 0% in Type II, n=90 days, x= 25%
To reach 1 million DAU, we need to spend ~9x money in Type II compared to type I
Retention creates a big gap in long-term sustainable growth. The gap keeps widening over time. This way, retention has a huge cost to the company.
The problems with retention are also not obvious in the beginning, so startups don’t care much about it. Over time, they realize the mistake but since retention takes a long time to fix, sometimes it’s too late for a startup to fix this problem and get sustainable growth.
Now that we have a good sense of the two types of retention problems, we can clearly see that Type II is a difficult problem to have. That said even if it’s a Type I problem, one should remember that competing products with higher y% have a big advantage over you in the long run, and the sooner you fix it the better it is.
Why is my retention low?
It’s clear from the previous section that there are two objectives to chase around retention.
Flatten the curve (move y% from 0 to a non-zero value)
Shift the retention curve up (increase y%)
We can’t achieve these goals without knowing the root cause of low retention. Knowing the root cause is the stepping stone in fixing retention problems.
There are three reasons why your retention could be actually low
You are attracting the wrong users to your product. Here acquisition is the issue. You can fix it by figuring out which kind of users are finding value in your product.
Users aren’t able to see the value in your product. You can fix it by building the right onboarding experience. Here is a detailed post I wrote on this.
Your product doesn’t have any value to offer for the end-user. This one is hardest to fix because this means that the entire foundation of your product is questionable. This might lead to a pivot, or killing the product.
But how do we figure what’s the reason for the low retention?
Figuring the reason for low retention
Diagnosing the problems in retention requires both Quantitative (Quant) and Qualitative (Qual) methods.
The qualitative method involves collecting and analyzing non-numerical data (e.g., text, video, or audio) from users to understand them. We get the non-numerical data through interviews, focus group studies, forums, etc.
The quantitative method relies on numerical data that is generated through the website/app, surveys, etc.
We start with quant as that is readily available in the analytics tool. Here we need to answer a few questions. You can ask the data to team figure out these from the analytics tool or do it yourself.
You are attracting the wrong users to your product
Bounce rate across segments
To start with, you can just take a look at the bounce rate across different segments of users. The bounce rate is defined as % of users who come to your website/app and do nothing. As a rule of thumb, if the bounce rate of a segment > 40%, you need to look deeper. You can benchmark the bounce rate of similar websites using Similarweb.
Activation and retention across segments
You should also check the activation and retention metrics across segments like Demographics (age, gender, geography), marketing channels (are some channels bringing you the wrong set of users?), etc. Usually, if there is a big gap in bounce rate, activation, and retention across segments, you can eliminate the segments which aren’t performing and improve your overall retention.
Users aren’t able to see the value in your product
Activation rate
What % of users are experiencing the aha! moment? In other words, figure out the activation rate for the overall product and benchmark it with similar apps in the category.
Success patterns
If you are finding it hard to figure the aha! moment of the product, finding correlations between actions and retention (successful behavior) can give you the answer.
Facebook did this by analyzing and figuring out that if people had more than 7 friends in the first 10 days, their retention was high. So they build products which made finding and adding friends easier like contact list based suggestions, people you may know, etc.
It should be noted that a strong correlation between an action and retention doesn’t mean that more people doing it will definitely lead to higher retention. But it’s worth a shot because in many cases, it would.
Your product doesn’t have any value to offer for the end-user
Surveys
To evaluate this, we need to use the SATISFY framework. What % of my current userbase would be disappointed if they would not be able to use the product in the future?
You can answer this by doing a survey. More about this survey here. This % should be higher than 40%. Use the SATISFY framework to also narrow down the TG that loves your product, and understand why. If you don’t find many people who will be disappointed, it is a red flag that people don’t see any value in your product.
You can also use NPS surveys to understand customers.
L30 curve
L30 curve gives you a good sense of usage frequency and stickiness. Look at the L30 curve for the cohort that experienced the aha! moment. If the curve looks don’t look good, it’s a sign of lack of value.
Bonus question for monitoring product health
Retention across cohorts
If you are already working on improving retention, a good thing to monitor the health of the product would be measuring retention across weekly or monthly cohorts. Is it moving up?
Figuring the reason for low retention through Qualitative Methods
The quant analysis helps us figure what’s wrong, Qual will tell us why it’s wrong. Understanding the why is equally important as it helps us take the right measures to course correct.
Though there are many qualitative research methods that you can read about, what I have found most useful are usability testing and one-on-one user interviews. I will be covering both in next month's essays around experimentation.
Usability Testing
Usability testing is assessing whether your product is usable or not. This involves sitting with a user, letting them use the app/website to perform certain tasks. We then observe whether the user faces some issues in getting the task done.
For example, if you are a PM at Make My Trip (MMT), you can ask users to book a ticket using MMT and see the problems different users face. Here is a good diagram explaining usability testing.
User Interviews
User interviews involve talking to users to understand their problems, motivations, aspirations, etc.
User interviews are the holy grail of insight building and like all the best things in life, are often ignored by PMs and marketers. Here is a good primer on user interviews if you want to read more.
More on this next month.
As you can only do limited sessions with users because of time constraints, some of the findings from the qualitative methods need to be validated further. The validation can come through surveys. You can ask specific questions in surveys to a higher number of users (>1000) to validate these findings and be confident of them.
So much Gyan! Let’s get to some real-life examples of how products solve their retention problems.
At the time, Airbnb was part of Y Combinator. One afternoon, the team was poring over their search results for New York City listings with Paul Graham, trying to figure out what wasn’t working, why they weren’t growing. After spending time on the site using the product, Gebbia had a realization. “We noticed a pattern. There's some similarity between all these 40 listings. The similarity is that the photos sucked. The photos were not great photos. People were using their camera phones or using their images from classified sites. It actually wasn't a surprise that people weren't booking rooms because you couldn't even really see what it is that you were paying for.”
Graham tossed out a completely non-scalable and non-technical solution to the problem: travel to New York, rent a camera, spend some time with customers listing properties, and replace the amateur photography with beautiful high-resolution pictures. The three-man team grabbed the next flight to New York and upgraded all the amateur photos to beautiful images. There wasn’t any data to back this decision originally. They just went and did it. A week later, the results were in: improving the pictures doubled the weekly revenue to $400 per week. This was the first financial improvement that the company had seen in over eight months. They knew they were onto something.
Airbnb solved its activation problem by putting beautiful photos of apartments. They spent a lot of time during the early days of Airbnb talking to customers in NY and improved the product on those insights. Some of these insights like better photos, more information about listings make so much logical sense that you don’t even need to validate further. These insights are kind of ‘aha! moments’ of product development for the founders and PMs :)
Intercom.io — Let’s look at how Intercom analyses the success and failure patterns to monitor retention and finding ways to improve retention. From Intercom blog,
Intercom.io’s Des Traynor argues that not all churn is equal, and that cancellation is the final straw in a process that begins much earlier. Thus, Intercom.io’s automated emails focus on re-engaging entire teams whose interaction is lagging.
The Research
Traynor identifies “Activity Churn” as a phenomenon that occurs prior to cancellation, as depicted in the chart below:
Before cancellation ever happens, there are clear signals that a customer is in danger of churning. Engagement flags, and your product or service goes from an everyday occurrence to being used once a week, then once a month. Finally, they decide it’s a waste of money altogether.
How it helps?
The most effective time to address churn is when you see a drop in usage across an entire team. This is where many auto-mailers get it wrong, spitting back “We miss you, please come back” emails to users who simply took a week vacation. For most SaaS apps it’s acceptable for a user from a team to disappear; it’s when the activity of an entire team is dropping that you worry you’re losing a customer.
When you identify previously active customers who are slipping, a well-timed personal email can help to re-engage them. The best case is that you recover a customer; the worst case is you learn why you users leave. Either of these leaves you in a better position than doing nothing.
The key is understanding that churn happens long before customers decide to cancel.
Hopefully, I have convinced you to do a few things (quant/qual) to actively identify and monitor retention. Off to questions,
Q: What if I can’t flatten the curve? Can my business still work?
A: Upfront payment products like online courses at Udacity or upGrad can still work in absence of any meaningful retention. For example, Udacity charges $500 for a course and acquires a customer at $150. It is already operating at an LTV > 3x of CAC.
The caveat here is that if users don’t complete the courses after buying it, it is an indicator that these online courses are creating not much value. This means lesser word of mouth and negative recommendation. This will hurt the company eventually.
So such companies with the upfront payment model should actively monitor the NPS and completion rate of the courses. Or it will come to haunt you just like retention.
Q: What’s next?
A: Next post is a step-by-step guide on what can you do to improve retention. The problem with such guides is they become a list of bullet points and useless. I will try to avoid that actively :)
That’s all for this week. Goodbye, and see you next week. Comment or DM me in case you have any questions/suggestions.